Why Blood Sugar Swings Matter More Than You Think
For years, HbA1c has been the gold standard for diabetes management. But HbA1c is an average — it hides the dangerous highs and lows of daily life. Two people may both show an HbA1c of 7%, but one could have stable glucose while the other swings from hypoglycaemia to extreme spikes.
Glycaemic variability (GV) refers to the degree of these swings. Research shows GV is not just a bystander; it is an independent predictor of diabetes complications.
A meta-analysis in Diabetes Care found patients with high GV had a 2.7x greater risk of retinopathy compared to those with stable glucose, even when HbA1c was matched.
Another study showed a coefficient of variation (CV) above 36% strongly correlated with severe hypoglycaemia.
This means flattening your curve is just as important as lowering your HbA1c.
The Science Behind Glucose Fluctuations
When glucose swings sharply, the body experiences repeated cycles of oxidative stress and inflammation.
Spikes promote the production of reactive oxygen species (ROS), which damage blood vessels.
Rapid drops trigger the release of stress hormones such as adrenaline and cortisol, which further destabilise glucose.
Over time, this contributes to endothelial dysfunction, a pathway leading to heart disease and stroke.
So, blood sugar swings are not only uncomfortable in the short term (fatigue, cravings, headaches), they actively accelerate long-term complications.
How to Read Your Glucose Curve
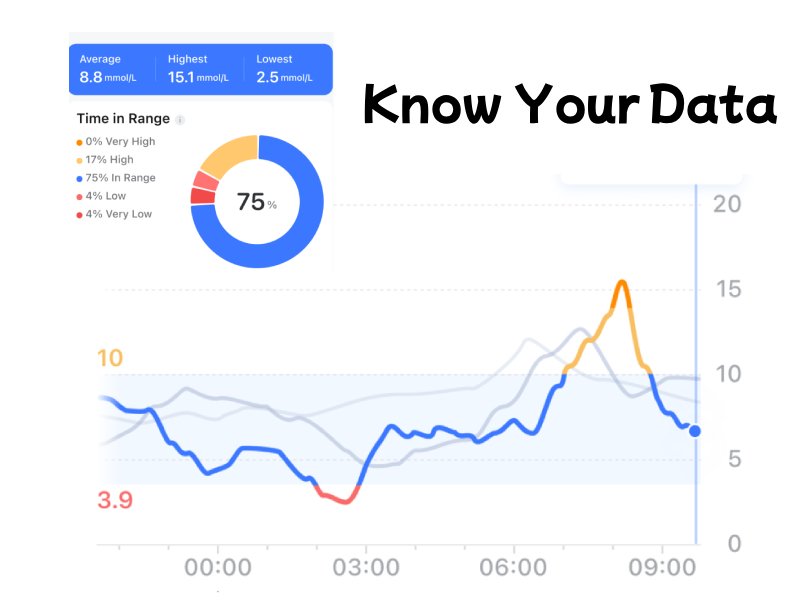
Continuous Glucose Monitoring (CGM) has changed how we measure glucose. Instead of occasional finger-pricks, it shows minute-by-minute curves. These are interpreted through three global metrics:
TIR (Time in Range): Aim ≥70% of time in 3.9–10 mmol/L.
TAR (Time Above Range): Should be <25%.
TBR (Time Below Range): Should be <4%.
If your curve shows repeated sharp spikes after meals or steep crashes within 2 hours, you are experiencing excessive GV.
Key cut-offs: Standard deviation (SD) > 40 mg/dL (≈2.2 mmol/L) = high variability. CV >36% = unstable control.
What Australian Data Shows
Diabetes is a major health challenge in Australia:
1.5 million Australians live with diabetes, with Type 2 accounting for 85–90% (AIHW, 2023).
2 in 3 adults are overweight or obese, fuelling rising insulin resistance.
The average Australian diet gets ~42% of calories from carbs, much of it from refined grains.
Common staples and their glycaemic index (GI):
White bread: ~70
Jasmine rice: ~89
Cornflakes: ~81
Sweet potato: ~54
Lentils: ~32
Barley: ~25
It’s easy to see why blood sugar swings are so common: a typical Aussie breakfast of cornflakes or white toast can send glucose up by 4–6 mmol/L within 45 minutes.
Short-Term vs Long-Term Swings
Short-term variability: Rapid swings within hours, often after meals. This explains “sugar crashes” and fatigue.
Long-term variability: Day-to-day differences, such as higher readings after certain dinners or on stressful days.
Both are harmful, but long-term variability is more predictive of complications like kidney disease. CGM helps track both patterns.
Case Example: Breakfast Choices
Let’s compare two common Australian breakfast options, as shown on CGM:
White toast with jam (GI ~70–75):
Glucose jumps from 5.8 → 11.2 mmol/L in 45 minutes.
Crash below baseline (4.5 mmol/L) after 2 hours.
Symptoms: fatigue, hunger before lunch.
Rolled oats + Greek yoghurt + nuts (GI ~40–45):
Glucose rises gently to 7.8 mmol/L.
Smooth return to baseline by 3 hours.
Symptoms: stable energy, reduced cravings.
Calories may be similar, but the curve is drastically different.

Why This Matters for Australians
The NDSS (National Diabetes Services Scheme) now subsidises CGM for people with Type 1 diabetes and many with Type 2 on insulin. For others, affordable CGM options are becoming available.
For Australians living in a food environment rich in refined carbs — white bread, rice, processed cereals — CGM is not just about numbers. It is a personalised feedback tool to reshape diet.
Final Takeaway
Blood sugar swings are not harmless “ups and downs.” They are measurable risks linked to oxidative stress, vascular damage, and higher complication rates. By combining CGM insights with smart food choices — oats instead of cornflakes, lentils instead of rice, vegetables before carbs — Australians can flatten their curves, improve Time in Range, and protect long-term health.
The best curve is not the lowest or flattest possible, but the one that gives you stability and sustainability day after day.
Hirsch IB, Brownlee M. Should minimal blood glucose variability become the gold standard of glycemic control? Diabetes Care. 2005.
Gorst C, et al. Long-term glycaemic variability and risk of adverse outcomes: meta-analysis. Diabetes Care. 2015.
Bao J, Atkinson F, Petocz P, Willett WC, Brand-Miller JC. Prediction of glycemic index by different methods. Am J Clin Nutr. 2011.
Australian Institute of Health and Welfare (AIHW). Diabetes in Australia, 2023.
Shukla AP, et al. Food order has a significant impact on postprandial glucose and insulin levels. Diabetes Obes Metab. 2015.
Monnier L, et al. Glycaemic variability and oxidative stress: a link between diabetes and cardiovascular disease. Diabetes Care. 2006.