Your glucose is a little higher than usual after lunch. Is it still rising, or has it started to come back down? At your next appointment, you may also want to explain what happened over the past few weeks: when your readings varied most, what you ate and whether you took your medication as planned.
The Ottai app brings glucose readings, trend graphs, health logs and reports together. Knowing how to use these features makes it easier to review your data, keep useful records and discuss them with your family or healthcare team.
1. See Your Current Reading and Recent Glucose Trends
In the app
Live readings: Sensor — The reading, trend arrow and timestamp are displayed on this screen.
Graph time window: Sensor → Tap 3h, 8h, 12h or 24h
The Sensor screen shows your current glucose reading, a trend arrow, the reading’s timestamp and your sensor’s remaining wear time. The number tells you your glucose level at that moment; the arrow indicates its recent direction of change.
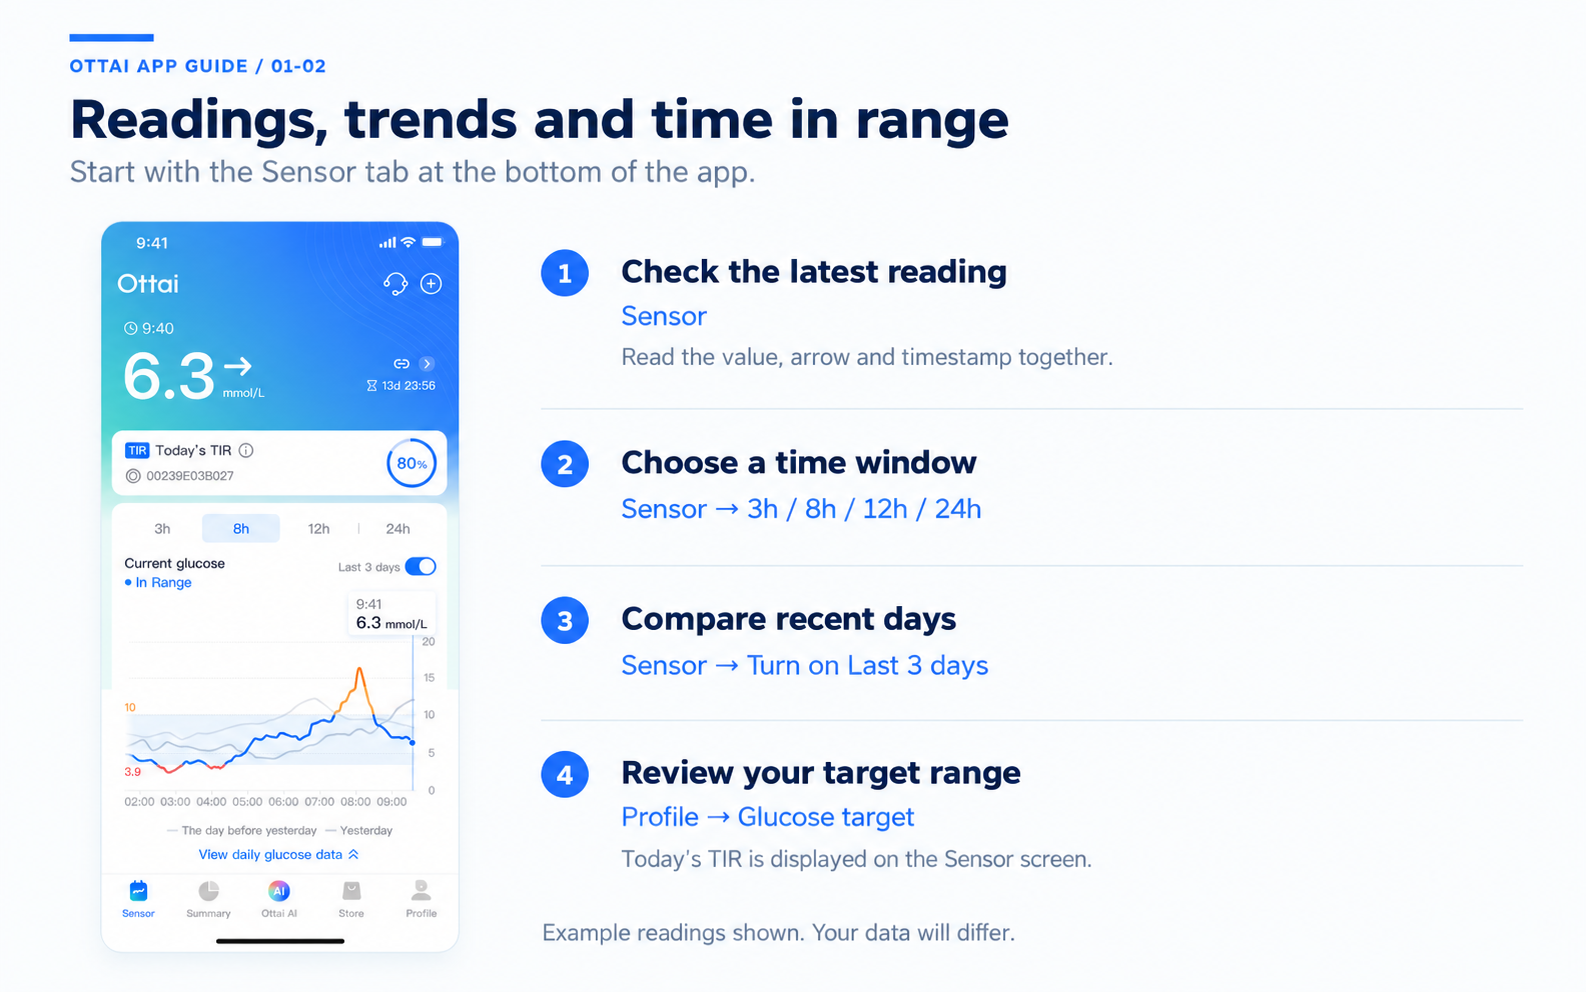
Figure 1. Current readings and recent glucose trends
You might see a similar number on two occasions, but the pattern behind it could be different. Your glucose may be rising on one occasion and levelling off on another. Looking at the reading, arrow and graph together gives you more context.
You can switch between 3-, 8-, 12- and 24-hour graph views. A shorter view is useful for reviewing what happened around a meal, while the 24-hour view helps you look across the day and night. Check the timestamp too, so you know how recent the displayed reading is.
2. Compare Recent Days and Check Your Time in Range
In the app
Three-day comparison: Sensor → Turn on Last 3 days
View TIR: Sensor — Look for the Today’s TIR card; no extra tap is needed.
Target range: Profile → Scroll to Device settings → Glucose target
Turn on Last 3 days to display today’s, yesterday’s and the previous day’s glucose patterns on the same graph. This makes it easier to compare similar times across different days.
For example, if you often notice a rise after breakfast, you can review that period over several days alongside what you ate and when. You may spot a recurring pattern worth recording or discussing at your next appointment.
Today’s TIR offers another way to review your data. Time in range, or TIR, is the percentage of time your glucose stays within your target range during the period being measured. Today’s figure reflects the data recorded so far, so consider how much of the day has been captured when you review it.[1]
You can view and set your target range under Glucose target in Profile. Agree on a suitable range with your healthcare team, and look at TIR alongside the graph and any periods above or below your target.
3. Review Your Glucose Over Time with Summary
In the app
Statistics: Summary → Choose 1 Day, 7, 14, 30 or 90 — Review the Overview section below the time-range selector.
Summary offers 1-, 7-, 14-, 30- and 90-day views of your recorded data. The Overview section includes your average, highest and lowest readings, along with eHbA1c. The graph helps you put those figures into context.

Figure 2. Summary and glucose statistics
Use the single-day view to review a particular day. As you collect more data, longer views can help you understand how your glucose has changed over time. When comparing periods, consider whether your sensor wear and data recording were consistent.
eHbA1c is an estimate of HbA1c calculated from glucose data. It may differ from an HbA1c result measured through a laboratory blood test and does not replace that test.[2]
4. Add Context with Health Logs and Weight Records
In the app
Health log: Profile → Health Log
Daily entries: Summary → Scroll to Daily logs
Weight plan: Summary → Scroll to Daily weight → Set your weight plan
A few days after a glucose rise, it can be difficult to remember what you ate or when you took your medication. Health Log and the Daily logs section in Summary help you keep those details in the app.

Figure 3. Health logs and weight records
Record categories include carbohydrate intake, insulin, medication and blood glucose meter readings (BG). Keeping accurate entries gives you information to refer back to when reviewing your graph or explaining a particular day to your healthcare team.
When looking at your glucose after lunch, for instance, you can refer to your carbohydrate and medication records for that meal. Comparing similar situations over several days can help you ask more specific questions. A single change in glucose, on its own, cannot establish the effect of a particular food or medication.
Summary also includes Daily weight and Set your weight plan. If you are tracking your weight, you can record it, set a plan and review your progress alongside your other health records.
5. Set Alerts for Changes That Need Your Attention
In the app
Alert settings: Profile → Scroll to Device settings → Alerts
Save changes: Alerts → Adjust the relevant settings → Scroll down → Save
You cannot keep checking your phone throughout work, household tasks or rest. The Alerts screen provides several types of notification to prompt you to check what is happening.
Figure 4. Glucose alerts and notification settings
You can set thresholds for high and low alerts. Depending on the alert type, you can also adjust the interval, ringtone, vibration and repeat settings. High alert includes a Delay first high alert option. Glucose targets and alert thresholds serve different purposes, so review both with guidance from your healthcare team.
The Glucose broadcasts feature reads your glucose values aloud, offering another way to access your readings when looking at the screen is difficult.
The Quiet modes setting turns off alert sounds and vibration for up to 24 hours. Keep this in mind if you rely on audible or vibration alerts. The app recommends keeping Urgent low alert enabled.
Alert delivery also depends on your sensor connection, notification permissions and phone settings. Check these when you first set up the app or move to a new phone.[3]
Paths for individual settings
· High glucose: Profile → Alerts → High alert → Save
· Low glucose: Profile → Alerts → Low alert → Save
· Urgent low glucose: Profile → Alerts → Urgent low alert → Save
· Rapid changes: Profile → Alerts → Rapid rise alert / Rapid drop alert → Save
· Signal loss: Profile → Alerts → Scroll to System alerts → Signal loss → Save
· Voice readings: Profile → Alerts → Glucose broadcasts → Save
· Quiet mode: Profile → Alerts → Quiet modes → Save
· Delay first high alert: Profile → Alerts → High alert → Delay first high alert → Save
6. Prepare for Appointments with Glucose Reports
In the app
Existing reports: Profile → Report → Tap a dated report
Custom date range: Profile → Report → Custom time range
Open Report in Profile to find existing glucose reports by date. The Glucose reports screen also includes Custom time range, so you can select the period you want to review.

Before an appointment, you might review the data collected since your last visit. If your routine has recently changed, you can select the relevant dates and look back over that period.
Reviewing a report beforehand and noting two or three questions can make the discussion more focused. You might ask why readings are often higher at a particular time, or whether low readings have been recurring overnight. Reports provide useful information for that conversation; clinical decisions also depend on symptoms, medication and other test results.
7. Share Glucose Data with People You Trust
In the app
Sharing settings: Profile → Data Sharing — Follow the on-screen setup and permission instructions.
Data Sharing in Profile lets you set up glucose data sharing. Once the relevant permissions and connections are in place, the family members or caregivers you authorise can view the information you share.[3]

Figure 6. Data sharing and device connections
This can be useful if you live apart from family or would like someone else to help you keep track of day-to-day changes. It reduces the need to send repeated screenshots or describe individual readings, and gives you the same data to discuss.
Before setting up sharing, agree on what you would like the other person to look at and how you will contact each other when needed. Sharing data does not mean someone is watching continuously or will respond immediately.
8. Use Ottai Watch and Ottai Hub for Additional Connections
In the app
Watch connection: Profile → Ottai Watch
Other connections: Profile → Ottai Hub
Ottai Watch provides access to watch connection options, allowing you to view glucose information on a compatible smartwatch. A glance at your wrist can be convenient while walking, commuting or keeping your phone in a bag. Check the compatibility information in the app for supported devices and connection methods.[4]
Ottai Hub, also in Profile, provides options for connecting glucose data with supported tools. If you already use a compatible service, check the available options and follow the setup and authorisation instructions. Availability may differ by phone operating system and app version.[4][5]
9. Find Everyday Help with Ottai AI
In the app
Ask a question: Ottai AI → Use the text field or voice control
Shortcuts: Ottai AI → Tap the feature you need
Support: Ottai AI → Customer support
Ottai AI supports text and voice interaction, with shortcuts to Today’s glucose, Health log, Sensor usage, My orders, Customer support and All functions.

Figure 7. Ottai AI and everyday shortcuts
If you are getting started, you can ask a specific question, such as “What does TIR mean?” or “What should I know about using my sensor?” Voice input offers an alternative when typing is inconvenient.
These features can help you find general information and learn how to use the app. If an order or device issue needs attention from the support team, you can also access Customer support from this screen.
AI responses can contain errors. They are intended for general information and support, and should not be used to diagnose a condition, change medication or decide an insulin dose.[3]
10. Find Customer Service, After-Sales Support and Help
In the app
Customer service: Profile → Scroll to Customer care → Customer service
After-sales: Profile → Scroll to Customer care → After-sales
Help centre: Profile → Scroll to Customer care → Help center
Feedback: Profile → Scroll to Customer care → Suggestions
Profile brings together Customer service, After-sales, Help center and Suggestions, so you can choose the appropriate route for a question, problem or piece of feedback.

Figure 8. Customer service and after-sales support
For questions about using a feature, start with Help center. Contact Customer service if you need further assistance. For sensor or after-sales issues, follow the prompts under After-sales. Having the time of the issue, relevant screenshots and device details ready can help the team understand what happened.
Profile also includes settings for signed-in devices, preferences, store access and activities. These give you a place to review account access, adjust preferences, purchase more sensors or check available activities.
Start by getting comfortable with your glucose graph and alert settings, then build a habit of recording and reviewing information that matters to you. When you want to discuss a particular change or explain recent patterns to your family or healthcare team, those records will be there to refer to.
Features and screens may vary by region, phone operating system and app version. Refer to the version available in your region and the product instructions. If your glucose readings do not match how you feel, check with a blood glucose meter as directed in the product instructions and seek medical advice when needed.[3]
Other shortcuts
· Profile → Sign-in devices
· Profile → Preferences
· Store tab, or Profile → Ottai Store → Buy now
· Profile → Activity
References
Feature descriptions are based on the Ottai app interface. Supporting references:
1. American Diabetes Association. CGM & Time in Range.
2. Bergenstal RM, et al. Glucose Management Indicator (GMI): A New Term for Estimating A1C From Continuous Glucose Monitoring. Diabetes Care. 2018;41(11):2275–2280.
3. Ottai. Terms of Use. Effective 15 August 2026.
4. Ottai. Functions and Data List.
5. AndroidAPS. Ottai M8 documentation.