Key Metrics in CGM Data
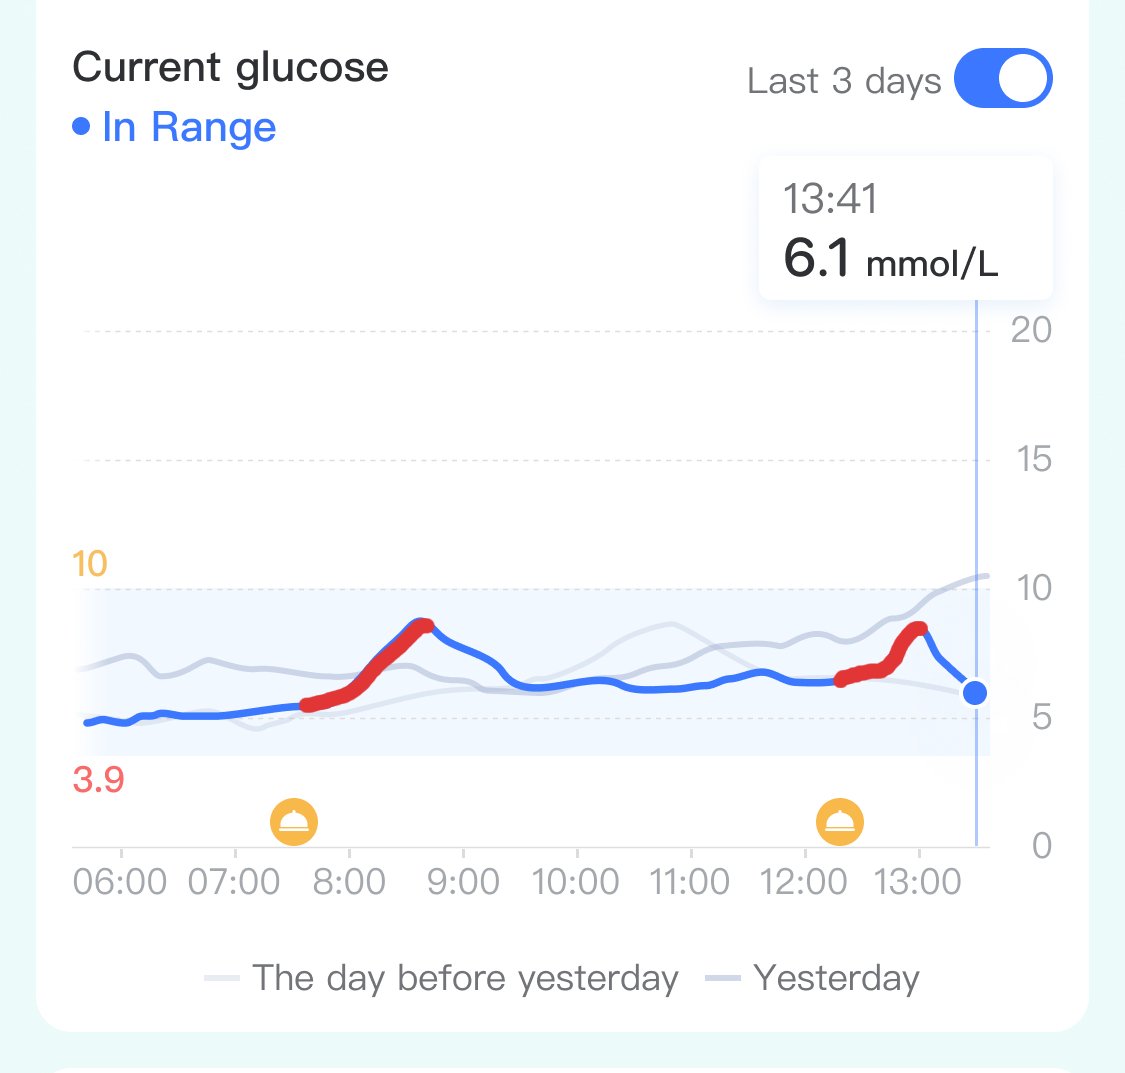
Current Glucose Value
A real-time snapshot, updated every few minutes.
Trend Arrows
Indicate direction and speed of change:
- ↑ = rising slowly (~0.1 mmol/L per minute)

- ↑↑ = rising quickly (>0.2 mmol/L per minute)

- ↓ = falling slowly (~0.1 mmol/L per minute)

- ↓↓ = falling quickly (>0.2 mmol/L per minute)

Time in Range (TIR)
Target range: 3.9–10 mmol/L.
- Aim for >70% of the day in this range.
Time Above/Below Range
- TAR: >10 mmol/L
- TBR: <3.9 mmol/L
The Physiology Behind Glucose Changes
Your glucose level does not change randomly – it follows predictable timelines depending on food, exercise, stress, and sleep. CGM lets you see these timelines clearly.
Meals
- Carbohydrates begin raising glucose within 10–15 minutes after eating.
- Peak usually occurs at 60–90 minutes.
- Return to baseline often takes 2–3 hours, depending on carb type, insulin response, and activity.
- Example: white rice → rapid rise, peak at ~1 hour; lentils → slower rise, peak at ~2 hours.

Exercise
- Light aerobic activity (walking, cycling): glucose often falls within 15–30 minutes, and effect can last up to 12–24 hours as insulin sensitivity improves.
- High-intensity or anaerobic exercise: may cause a temporary rise within minutes (due to adrenaline and cortisol), but typically stabilises within 1–2 hours, followed by improved overall control.

Stress
- Acute stress (work pressure, arguments, exams): cortisol and adrenaline can raise glucose within 20–30 minutes, sometimes sustaining elevated levels for several hours.
- Chronic stress: may show as persistently higher baseline levels, especially in the morning.
Sleep
- Poor sleep (late nights, <6 hours): glucose may run higher the following morning due to reduced insulin sensitivity.
- Dawn phenomenon: natural hormone release (cortisol, growth hormone) may cause glucose to rise between 4–7 AM, typically by 1–2 mmol/L.

How Lifestyle Behaviors Influence CGM Readings
Meals & Carbohydrate Quality
- High GI foods → sharp spike, quick return.
- Low GI foods → slower, gentler rise.
- Balanced meals with protein/fat → smoother curve.
Exercise
- Walking after meals reduces post-meal peaks by ~1–2 mmol/L.
- Prolonged sitting → flatter but higher curves.
Stress
- Unexpected jumps during stressful workdays, even without eating.
Sleep
- Consistent sleep = more stable fasting glucose.
- Irregular sleep = higher variability.
Interpreting Reports and Patterns
- Daily Glucose Profiles: Look for repeating spikes or drops.
- AGP Reports: Identify peak times (e.g., breakfast spikes, afternoon lows).
- Variability (CV): Target <36%.
Practical Strategies to Improve CGM Outcomes
- Swap high-GI carbs for low-GI.
- Walk for 10–15 minutes after meals.
- Manage stress with relaxation techniques.
- Prioritise 7–8 hours of quality sleep.
- Review CGM reports every week to identify patterns.
Clinical Significance
- Every 10% increase in TIR lowers long-term complication risk.
- Lower TBR means fewer hypoglycaemia events.
- CGM improves HbA1c and daily decision-making.
Conclusion
CGM gives you more than numbers – it shows how fast, how high, and how long your glucose changes after meals, exercise, stress, or sleep. By learning to read these timelines, you can act early, smooth out fluctuations, and protect your health.
Battelino, T., et al. (2019). Clinical Targets for Continuous Glucose Monitoring Data Interpretation: Recommendations From the International Consensus on Time in Range. Diabetes Care, 42(8), 1593–1603.
American Diabetes Association. (2023). Standards of Medical Care in Diabetes—2023. Diabetes Care, 46(Suppl. 1), S1–S150.
Beck, R. W., et al. (2019). Validation of Time in Range as an Outcome Measure for Diabetes Clinical Trials. Diabetes Care, 42(3), 400–405.
Riddell, M. C., & Perkins, B. A. (2018). Type 1 Diabetes and Vigorous Exercise: Applications of Exercise Physiology to Patient Management. Canadian Journal of Diabetes, 42(5), 421–428.
Tsai, Y. W., et al. (2020). Sleep Duration and Glycemic Control in Adults with Type 2 Diabetes: A Cross-sectional Study. Journal of Clinical Endocrinology & Metabolism, 105(3), e1153–e1160.